Observability Improvement Plan with Opentelemetry and Elastic Common Schema
Overview
Soongsil University ITSupport team provides a growing number of essential services to our students. As our user base expands, the demand for these services continues to rise.
To ensure the stability and reliability for our production environment, we have successfully implemented several infrastructure-level improvements. Including ECS Fargate with auto service scaling policies and CDN (CloudFront) for our static files distribution.
While these infrastructure upgrades have enhanced our production system stability, our applications still act as “black boxes”. For example, when the issues occurred in our production system, our developers struggle to quickly identify the failure points, trace request delay and efficiently troubleshoot the error. For example, if an error occurred in production system, user claims the issue to our administrator (ITSupport PM team) and they deliver the issue to the related developers. It is because there are lack of observability and notification system.
Therefore, to resolve this problem and ensure the rapid incident response, we must enhance our system’s Observability.
And to enhance the Observability, we need to setup the proper and standardized log format in all our backend systems.
Current problem
Let’s examine our current services’ logging formats
Student council homepage
- Multiline logs are not being parsed correctly by the observability backend.
[Critical]: Database connection logs are exposing secret values in CloudWatch.- API response times are missing from logs which make it hard for performance analysis.
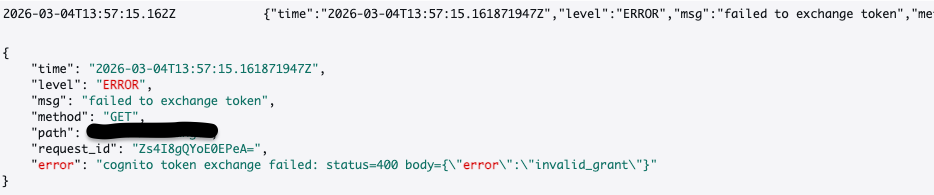
PASSU
It logs like this….
2026-03-14 10:00:00,123 - root - INFO - Application started
- It prints as a single line, making it difficult for the observability backend to parse efficiently.
- Lack of context also makes it hard to trace the entire stream.
SSUPORT
- No logging dependencies or code found.
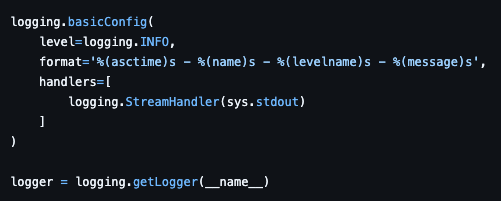
Student club homepage
- No logger configuration in
settings.py. - Using print statements instead of the logging library.
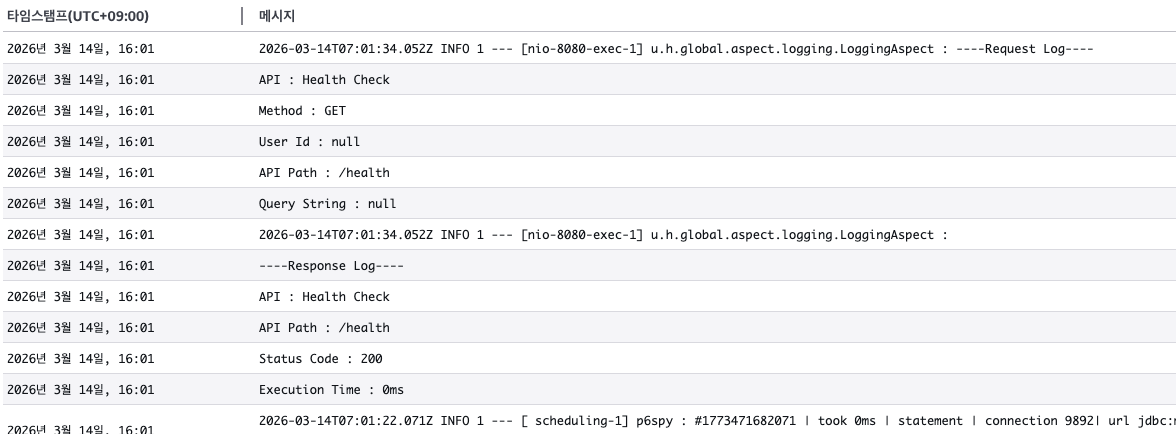
Single SignOn service
- Structured but not standardized. Different format from other services.
- Inadequate log attributes for observability.
Solution
To solve those problems, we need to standardize the log format in each service and establish a unified observability pipeline. Thankfully, there are enterprise-level standards in the open-source ecosystem that perfectly fit our needs.
Opentelemetry
Opentelemetry => tracability and transmission
Opentelemetry is not a logger itself, it is a CNCF standard for log manager which generate, collect and deliver the logs into observability backend system. Almost IT enterprises use this standard as their standard observability format to resolve the black box phenomenon in their complex application.
Advantages
-
OTelautomatically injects a valuetrace_idinto our system and every incoming request.trace_idallows us to track a single user request across the multiple micro services or through the internal function call stacks in a single application server. -
It provides standardized APIs and libraries, so we don’t need to change whole logger related codes when we change the observability backend. All observability services like Datadog, Splunk, AWS Cloudwatch, Grafana Loki support this standard.
Elastic Common Schema
Standard
Log Format
Elastic Common Schema (ECS) provides us to standardize the structure of logs. We can define proper JSON log format with common attributes (@timestamp, log.level, error.message, etc..).
Advantages
-
Unified log attribute naming convention. For example, in case of
erroreach application could use their error log attribute likeerr,err_msg,exception. In this case, it makes the developer and administrator hard to figure it out the error cases properly. But, if we use ECS format for our naming convention, this proper could be resolved. -
ECS enforces the JSON structured-logs, so that our observability backend system can instantly parse, index and filter the log data properly without further regex expressions.
Guide for developers
The core philosophy of our new observability architecture is the Separation of Concerns.
Developers should focus solely on writing business logic, while the infrastructure handles the log delivery (OpenTelemetry daemon).
EC2 based environment
Our development environment applications are running on single EC2 instance. So we could utilize a OpenTelemetry Daemon for log delivery.
- Application: Just install opentelemetry SDK, ECS-formatter library in our application and log it
package main
import (
	"context"
	"go.elastic.co/ecszap"
	"go.uber.org/zap"
	"go.opentelemetry.io/otel/trace"
)
func doBusinessLogic(ctx context.Context, logger *zap.Logger) {
	// 1. Get trace_id from the context
	span := trace.SpanFromContext(ctx)
	traceID := span.SpanContext().TraceID().String()
	// 2. Use ECS Format logger, and inject trace_id
	logger.Info("User requested data",
		zap.String("trace.id", traceID), // ECS 표준 필드명
		zap.String("user.id", "student_123"), // 추가적인 비즈니스 컨텍스트
	)
}
func main() {
	// ECS format zap library setting
	encoderConfig := ecszap.NewDefaultEncoderConfig()
	core := ecszap.NewCore(encoderConfig, os.Stdout, zap.DebugLevel)
	logger := zap.New(core)
}
- Infrastructure: Install
OpenTelemetry CollectororFluent Bitto run as a backend daemon process on the EC2. It automatically capture the log streams for all applications, and transmit them to our centralized monitoring system.
ECS Fargate based environment
Since we are using ECS Fargate as our production environment, we couldn’t access AWS Managed EC2 instance directly. Instead daemon process, we have to utilize Sidecar pattern
- Application: Just same with above
- SideCar Container (
AWS Firelens,Fluent Bit): Define secondary container in our application task definition. The sidecar container automatically capture the log stream from the application and deliver it to our centralized monitoring system.
Centralized monitoring system
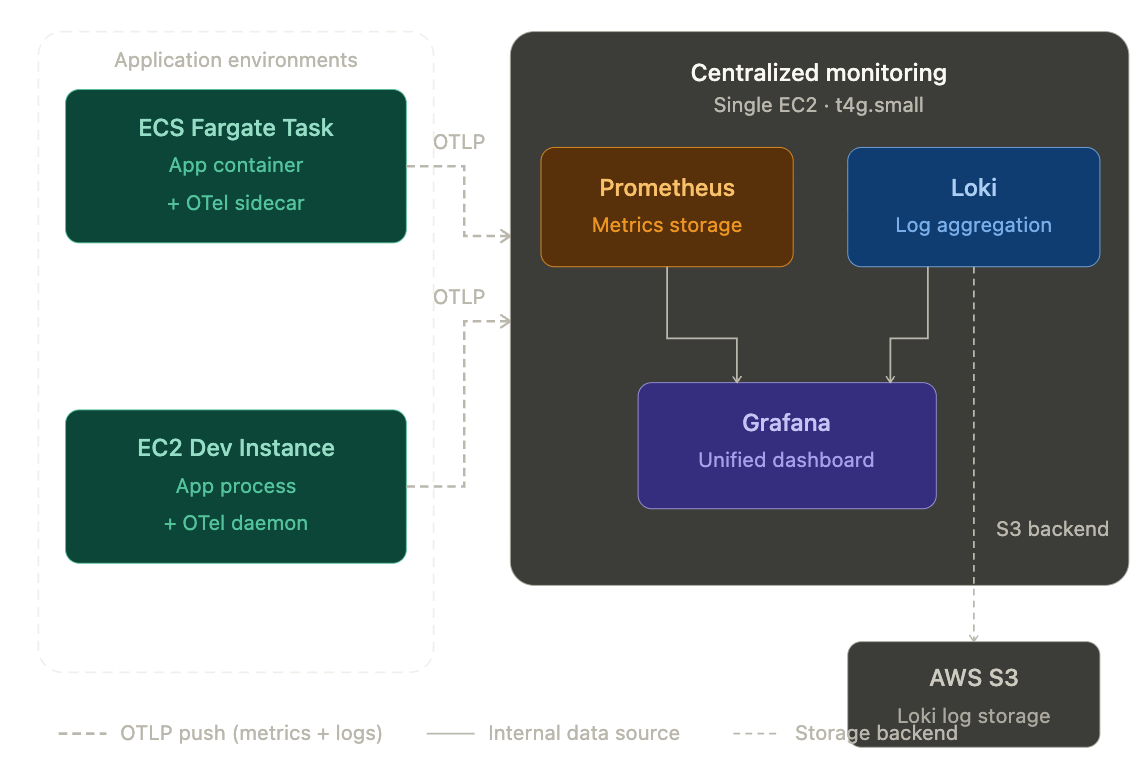
We will use Prometheus + Grafana Loki for our centralized monitoring system. It is open source, widely used monitoring system. Furthermore, we have to optimize the AWS Cost as much as possible.
All EC2 OpenTelemetry and ECS Fargate OpenTelemetry daemon, sidecar container will connected into the centralized monitoring system, which will be deployed into single EC2 container t4g.small spec with container.
Anticipating Impact
By applying this standardized OpenTelemetry and ECS pipeline across all our backend systems, we can anticipate:
-
Drastic Reduction in MTTR (Mean Time To Recovery): With distributed tracing, developers will no longer rely on guesswork or manual text searches across disparate log files. A single
trace_idwill trace the entire lifecycle of a request, find bottlenecks or errors in seconds. -
Proactive System Monitoring: Structured JSON logs enable us to build highly accurate dashboards and automated
Grafana Alertsbased on specific log attributes (e.g., spike inlog.level: "error"). We will be able to detect and resolve issues proactively, often before students even notice or report them. -
Enhanced Security & Performance: Shifting the log routing responsibility to infrastructure sidecars removes blocking I/O operations from our application code, improving overall throughput.
Additionally, centralized log filtering ensures sensitive credentials are never leaked to our observability platforms. (As you may know, we are handling the sensitive student information)